For MSSPs, email platforms, cyber insurers and data teams
Internet infrastructure intelligence you can act on.
We track new and high-risk domains daily, with their DNS, certificates, and routing, to expose attack infrastructure as it’s built. Discover hidden assets, assess vendor risk, and power your email & security products with explainable intelligence.
Latest coverage: 363.2M resolving domains · measured 25 Oct 2026 · Explore the Observatory →
What can I use it for?
Choose your team and your problem.
MSSPs
Spot attacks on clients' platforms before they land.
Add pre-compromise intelligence to your SOC service, under your own brand.
Learn more →Email platforms
Vet senders and links, and keep bad actors off the platform.
See who runs a sender's domain and mail before you onboard them.
Learn more →Cyber insurers
See concentration and exposure across a book.
Find shared providers and weak email controls across your insureds.
Learn more →Data teams
Join infrastructure data to your own, in your warehouse.
Query our datasets next to your own tables, with no data leaving your account.
Learn more →Investors and M&A
Check a portfolio or a target's domain estate.
Get a portfolio snapshot or a full estate report for a group of companies.
Learn more →Free Domain Health Report
See your domain the way an attacker sees it.
Enter your work email. We check the public infrastructure of its domain and email you the report.
Need the full picture? The Domain infrastructure report is $99. Buy the full report →
What the free report shows
Email controls
SPF, DMARC and MTA-STS, and what each one leaves open.
Platform impersonation
Lookalike domains that copy the platforms you rely on.
Hosting and subdomains
Where your domain is hosted, and which subdomains are exposed.
Not ready yet? View a sample report
Free Estate Scope
See the whole estate, not just one domain.
For one organization or a portfolio of up to 25: an insured, an acquisition target, your portfolio companies or your clients. We grade every domain you declare and email you the scope.
Need the full picture? The Organization estate report is from $299, priced by the registered domains you include.
What the free scope shows
Every declared domain graded
Email security, registration, certificates and exposed hosts, with the top issue for each.
The estate you didn't declare
Domains linked by certificates, mail and registration: counted, with three named as proof.
One finding in full
The evidence, the fix and how to check it, the way every finding in the full report reads.
Not ready yet? View a sample estate report
Evidence and sample outputs
See exactly what you get.
Each sample uses our real output format, run on a fictional organization.
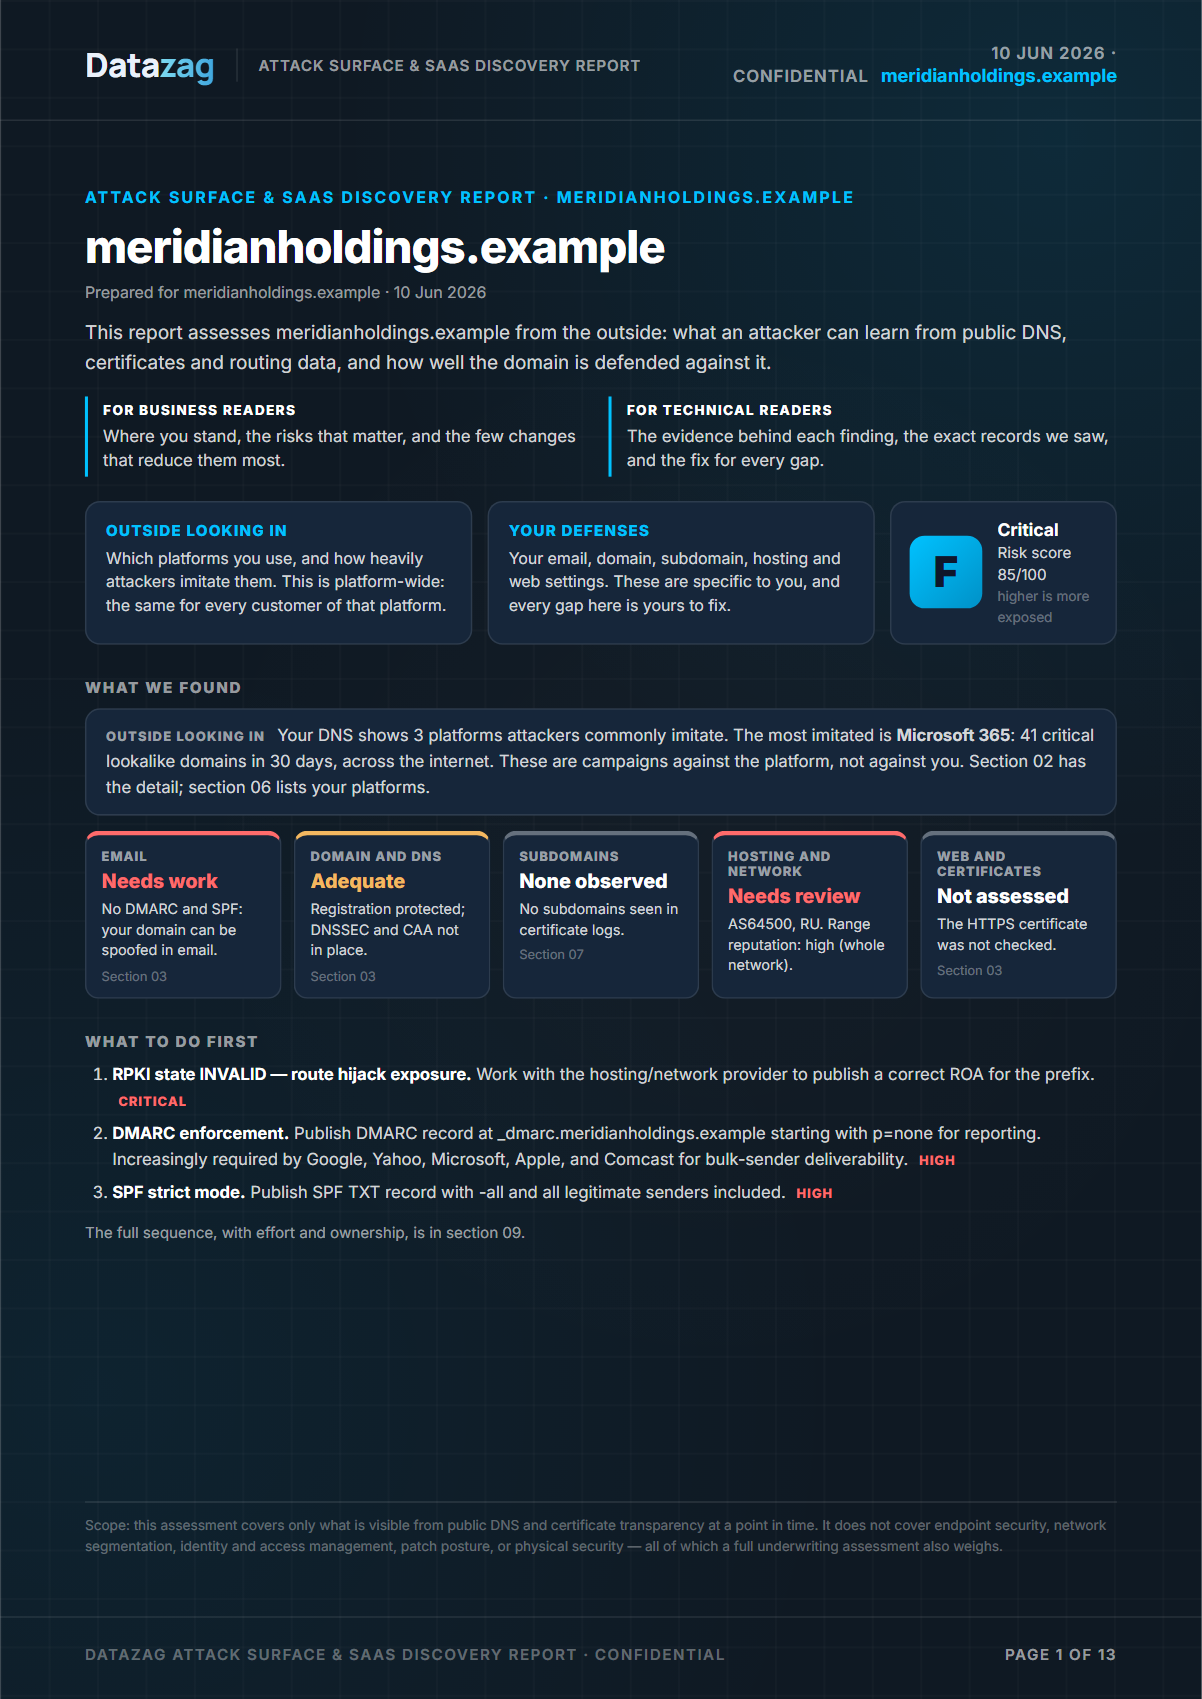
Domain infrastructure report
The full report for one domain: email controls, platform impersonation, hosting and subdomains, with a fix for each finding.
Samples use fictional organizations.
Coverage and methodology
What we see, and how we measure it.
We resolve DNS for every domain we know about. We read certificate transparency logs to find new names as certificates are issued. We add global routing data to place each address in the network that announces it. We collect all of this ourselves. We do not license threat feeds.
New and high-risk domains are checked daily. The full corpus refreshes about every two months.
- 1. Domains monitored: Domains in the Datazag corpus whose latest resolution returned records. Names that no longer exist (NXDOMAIN) and names whose servers failed are excluded. This is the figure the Datazag Observatory publishes as its corpus count.
- 2. IPs hosting domains: Distinct IPv4 addresses that a domain in the measured corpus resolves to, taken over the same population as the domain figure above.
- 3. IPv4 addresses indexed: IPv4 space announced in BGP and attributed to a network, counted once per address however many announcements cover it — a more-specific prefix inside its parent is not counted twice.
- 4. Networks profiled: Autonomous systems with ownership and routing context attached, used to place infrastructure in the network that announces it.
How we work with data
We don't use black boxes. Datazag builds every score and alert from deterministic evidence you can check yourself. That evidence comes from observable records, documented rules and verifiable signals. No opaque model decides how we score your domains or your customers. When we flag something, we show you why. You see the evidence, the rule it triggered and how much each factor contributed. You can verify our reasoning, challenge it, or ask us to change it as new information appears. Intelligence you can't explain is intelligence you can't act on with confidence.
Delivery
Use the data where you already work.
Reports in the portal
Order and read reports in the Datazag portal. Estate orders include PDF, HTML and CSV files.
See the reports →Snowflake Marketplace
Get our IP-to-ASN dataset as a free Snowflake listing. Query it like any other table.
See the dataset →Datasets arrive in your own warehouse. You join them to your data there, so your data stays in your environment.
Datazag Observatory
The internet's infrastructure, measured.
Free to explore and cite.
Live from the Observatory
Data as of 2026-10-25
49.4%
of DMARC records at enforcement
90.7M domains publishing DMARC · as of 2026-10-25
Method and denominator →
97.55%
of multi-origin prefixes are stable multi-homing
196,068 MOAS prefixes observed · as of 2026-10-25
Method and denominator →
6
networks carry half of all attributable domains
51,921 networks observed carrying domains · as of 2026-10-25
Method and denominator →
Pricing
Start free. Pay when you need more.
Domain health reports
- Free exposure snapshot: Free
- Domain infrastructure report: $99
Start with your own domain.
Get the free report and see what an attacker can see.